IBM SPSS Neural Networks
- Overview
- Features and Benefits
IBM® SPSS® Neural Networks offers non-linear data modeling procedures that enable you to discover more complex relationships in your data.
Using the procedures in IBM SPSS Neural Networks, you can develop more accurate and effective predictive models. The result? Deeper insight and better decision making.
What is a neural network?
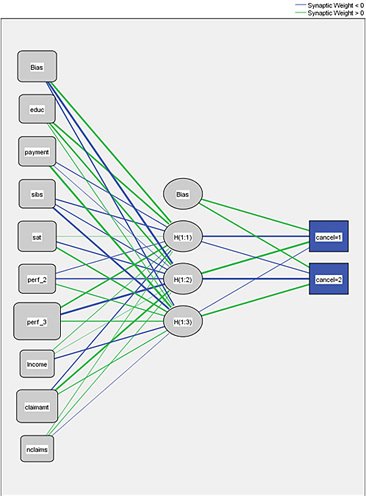
A computational neural network is a set of non-linear data modeling tools consisting of input and output layers plus one or two hidden layers. The connections between neurons in each layer have associated weights, which are iteratively adjusted by the training algorithm to minimize error and provide accurate predictions.
Complement traditional statistical techniques
The procedures in IBM SPSS Neural Networks complement the more traditional statistics in IBM SPSS Statistics Base and its modules. Find new associations in your data with Neural Networks and then confirm their significance with traditional statistical techniques.
How can you use IBM SPSS Neural Networks?
You can combine Neural Networks with other statistical procedures to gain clearer insight in a number of areas:
Market research
- Create customer profiles
- Discover customer preferences
Database marketing
- Segment your customer base
- Optimize campaigns
Financial analysis
- Analyze applicants’ creditworthiness
- Detect possible fraud
Operational analysis
- Manage cash flow
- Improve logistics planning
Healthcare
- Forecast treatment costs
- Perform medical outcomes analysis
Use data mining techniques
IBM SPSS Neural Networks provides a complementary approach to the data analysis techniques available in IBM SPSS Statistics Base and its modules. From the familiar IBM SPSS Statistics interface, you can “mine” your data for hidden relationships, using either the Multilayer Perceptron (MLP) or Radial Basis Function (RBF) procedure.
Both of these are supervised learning techniques – that is, they map relationships implied by the data. Both use feed-forward architectures, meaning that data moves in only one direction, from the input nodes through the hidden layer or layers of nodes to the output nodes.
Your choice of procedure will be influenced by the type of data you have and the level of complexity you seek to uncover. While the MLP procedure can find more complex relationships, the RBF procedure is generally faster.
With either of these approaches, the procedure operates on a training set of data and then applies that knowledge to the entire dataset, and to any new data.
Control the process from start to finish
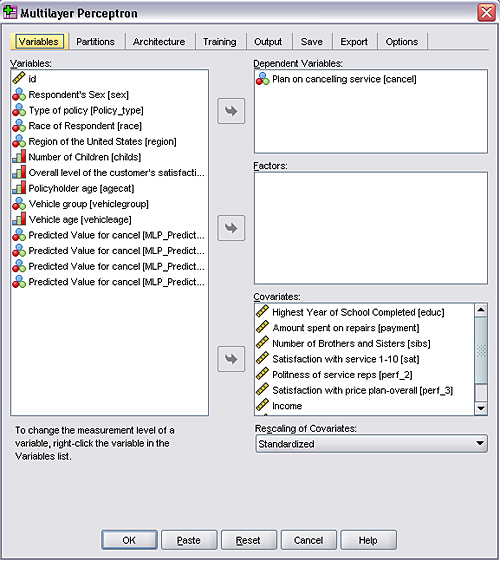
After selecting a procedure, you specify the dependent variables, which may be scale, categorical or a combination of the two. You adjust the procedure by choosing how to partition the dataset, what sort of architecture you want and what computation resources will be applied to the analysis.
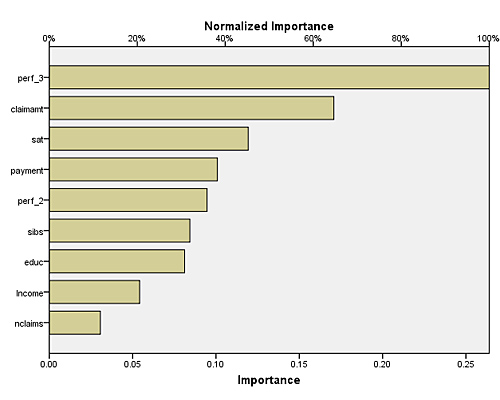
Finally, you choose whether you want to display results in tables or graphs, save optional temporary variables to the active dataset and/or export models in XML-based file format to score future data.


